
Mastering the Market: A Complete Guide to Live Stock Market Updates and Share Charts
Have you ever looked at a stock market chart or watched a live ticker and felt completely lost? Don’t worry—you’re not alone. The world of finance can look like a complex maze filled with numbers, fluctuating prices, and confusing graphs. But once you start decoding the basics, it becomes a fascinating and empowering journey.
In this guide, we’ll walk you through what a live stock market is, why it’s important, and how to read share market charts like a pro—even if you’re just getting started.
What is Stock Market Live?

“Stock Market Live” refers to real-time tracking of market activity—stock prices, indices, trading volumes, breaking financial news, and more. It’s like watching the heartbeat of the global economy, changing every second based on actions by millions of investors around the world.
Whether it’s a major stock like Tesla or a local Indian giant like Reliance, every tick on a live chart shows how the world is reacting at that moment.
Why Is Live Tracking Important?
Imagine planning a trip with no weather updates—you could be stuck in a storm. Similarly, investing without live data means you risk missing out on golden opportunities or getting hit by market drops. Real-time updates help you:
- 📊 Act on sudden market movements
- 🧠 Avoid guesswork
- 💰 Make timely buy/sell decisions
- 🛑 Reduce emotional and impulsive trading
Especially for day traders and scalpers, where every second counts, real-time tracking isn’t just useful—it’s essential.
What Do You See in a Live Market Feed?
When watching the stock market live, you don’t just see stock prices going up and down. You’re actually viewing a dynamic dashboard that includes:
- ✅ Indices (Sensex, Nifty 50, Dow Jones, NASDAQ)
- ✅ Individual stock prices (e.g., Infosys, Apple, TCS)
- ✅ Trading volume (shows market interest)
- ✅ Price change percentages
- ✅ Market-related news in real-time
- ✅ Live charts (Line, Bar, Candlestick)
Understanding Share Market Charts
So, what are all those zigzag lines and colored bars you see when you open a trading platform?
Share market charts are visual tools that show how a stock’s price has moved over time. Instead of reading rows of numbers, you can see trends—whether a stock is rising, falling, or remaining steady.
These charts are vital for analyzing trends, identifying patterns, and timing your trades smartly.
Types of Stock Market Charts
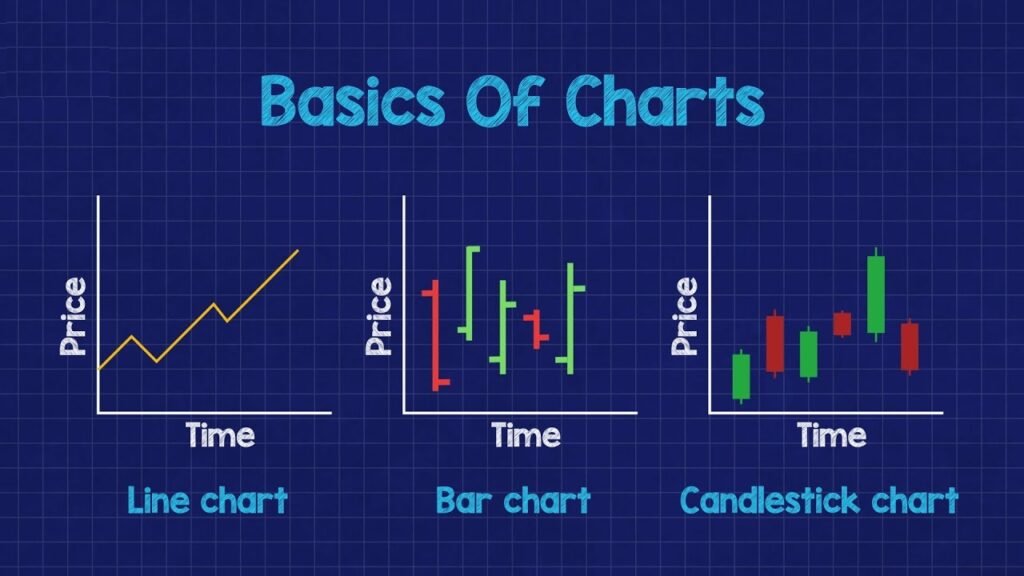
- Line Chart
- Simple and clean. It connects closing prices to show overall direction.
- Best for beginners.
- Bar Chart
- More detailed than a line chart.
- Displays open, high, low, and close (OHLC) prices.
- Candlestick Chart
- Most popular among traders.
- Each candle shows the same OHLC data but uses color and shape to make trend recognition easier.
- Green = Price went up, Red = Price went down.
Key Things to Look for in Charts
Here’s what you need to focus on while reading any chart:
- Time Frame – View data for a minute, hour, day, week, or year.
- Price Movement – Spot upward (bullish) or downward (bearish) trends.
- Volume – High volume = High interest.
- Support & Resistance – Key levels where a stock tends to stop falling or rising.
- Patterns – Like “head and shoulders”, “double top”, or “triangle breakouts”.
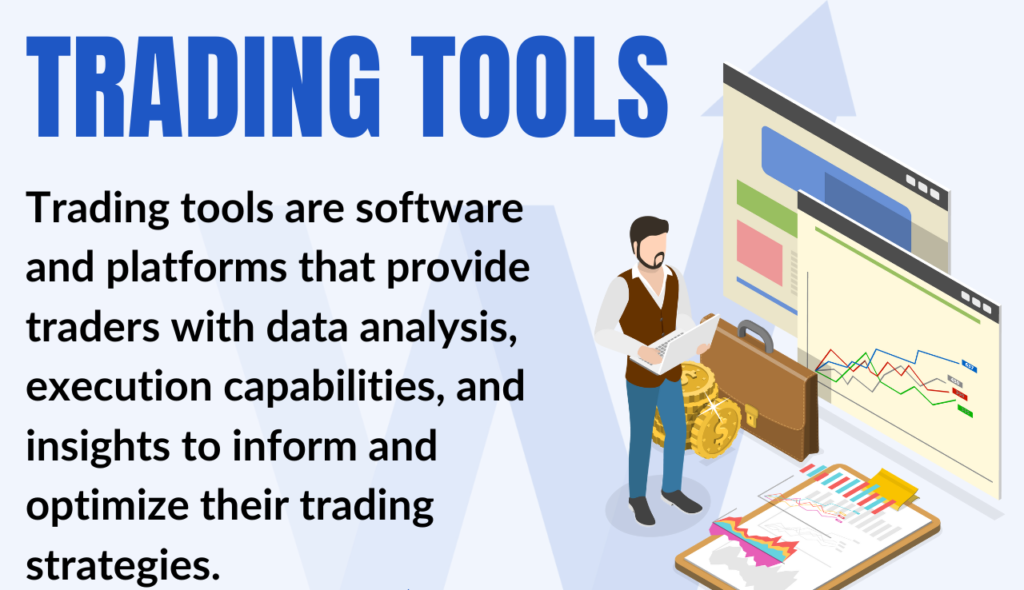
Best Tools & Platforms to Watch Live Market and Charts
You no longer need a Wall Street terminal to access powerful financial tools. Here are free and paid platforms to track the live market and use advanced charting:
- TradingView – Professional charting and real-time data.
- Moneycontrol (India) – Detailed market coverage, news, and live charts.
- Economic Times Market Section
- Yahoo Finance / Google Finance
- Zerodha Kite, Upstox, Groww – Indian brokerage apps with built-in live tracking & charting.
- MetaTrader / ThinkorSwim (for global traders)
Most of these platforms let you create watchlists, set price alerts, apply technical indicators (MACD, RSI, Moving Averages), and even do paper trading.
Mind Over Market: Handling the Psychology of Live Trading
Watching the market tick every second is thrilling, but it can also lead to emotional decision-making. Many beginners fall into the trap of:
- Chasing hype
- Selling in panic
- Overtrading
Remember, data is a tool, not a command. Use charts and live data to support your strategy—not replace it. Successful investors stick to plans, not emotions.

Is It Only for Experts? Absolutely Not!
Even if you’re just getting started, live market tracking and basic chart reading can help you:
- Learn how stocks behave in real time
- Understand news impacts instantly
- Build confidence in trading and investing
- Practice with virtual accounts before going live
Final Thoughts: Why You Should Learn This Now
Whether you’re planning to invest for the long term or trade daily, understanding how to watch the market live and read charts gives you a strong edge. It transforms you from a passive investor into an informed one.
By mastering live updates and visual tools like candlestick charts, you get to:
✅ Predict price moves
✅ Avoid emotional losses
✅ Seize opportunities
✅ Build wealth wisely
So the next time you look at a wavy chart or a fast-changing price ticker—don’t scroll past it. That’s not just a graph. It’s a map of market behavior… and it might just lead you to your next big win.

No responses yet